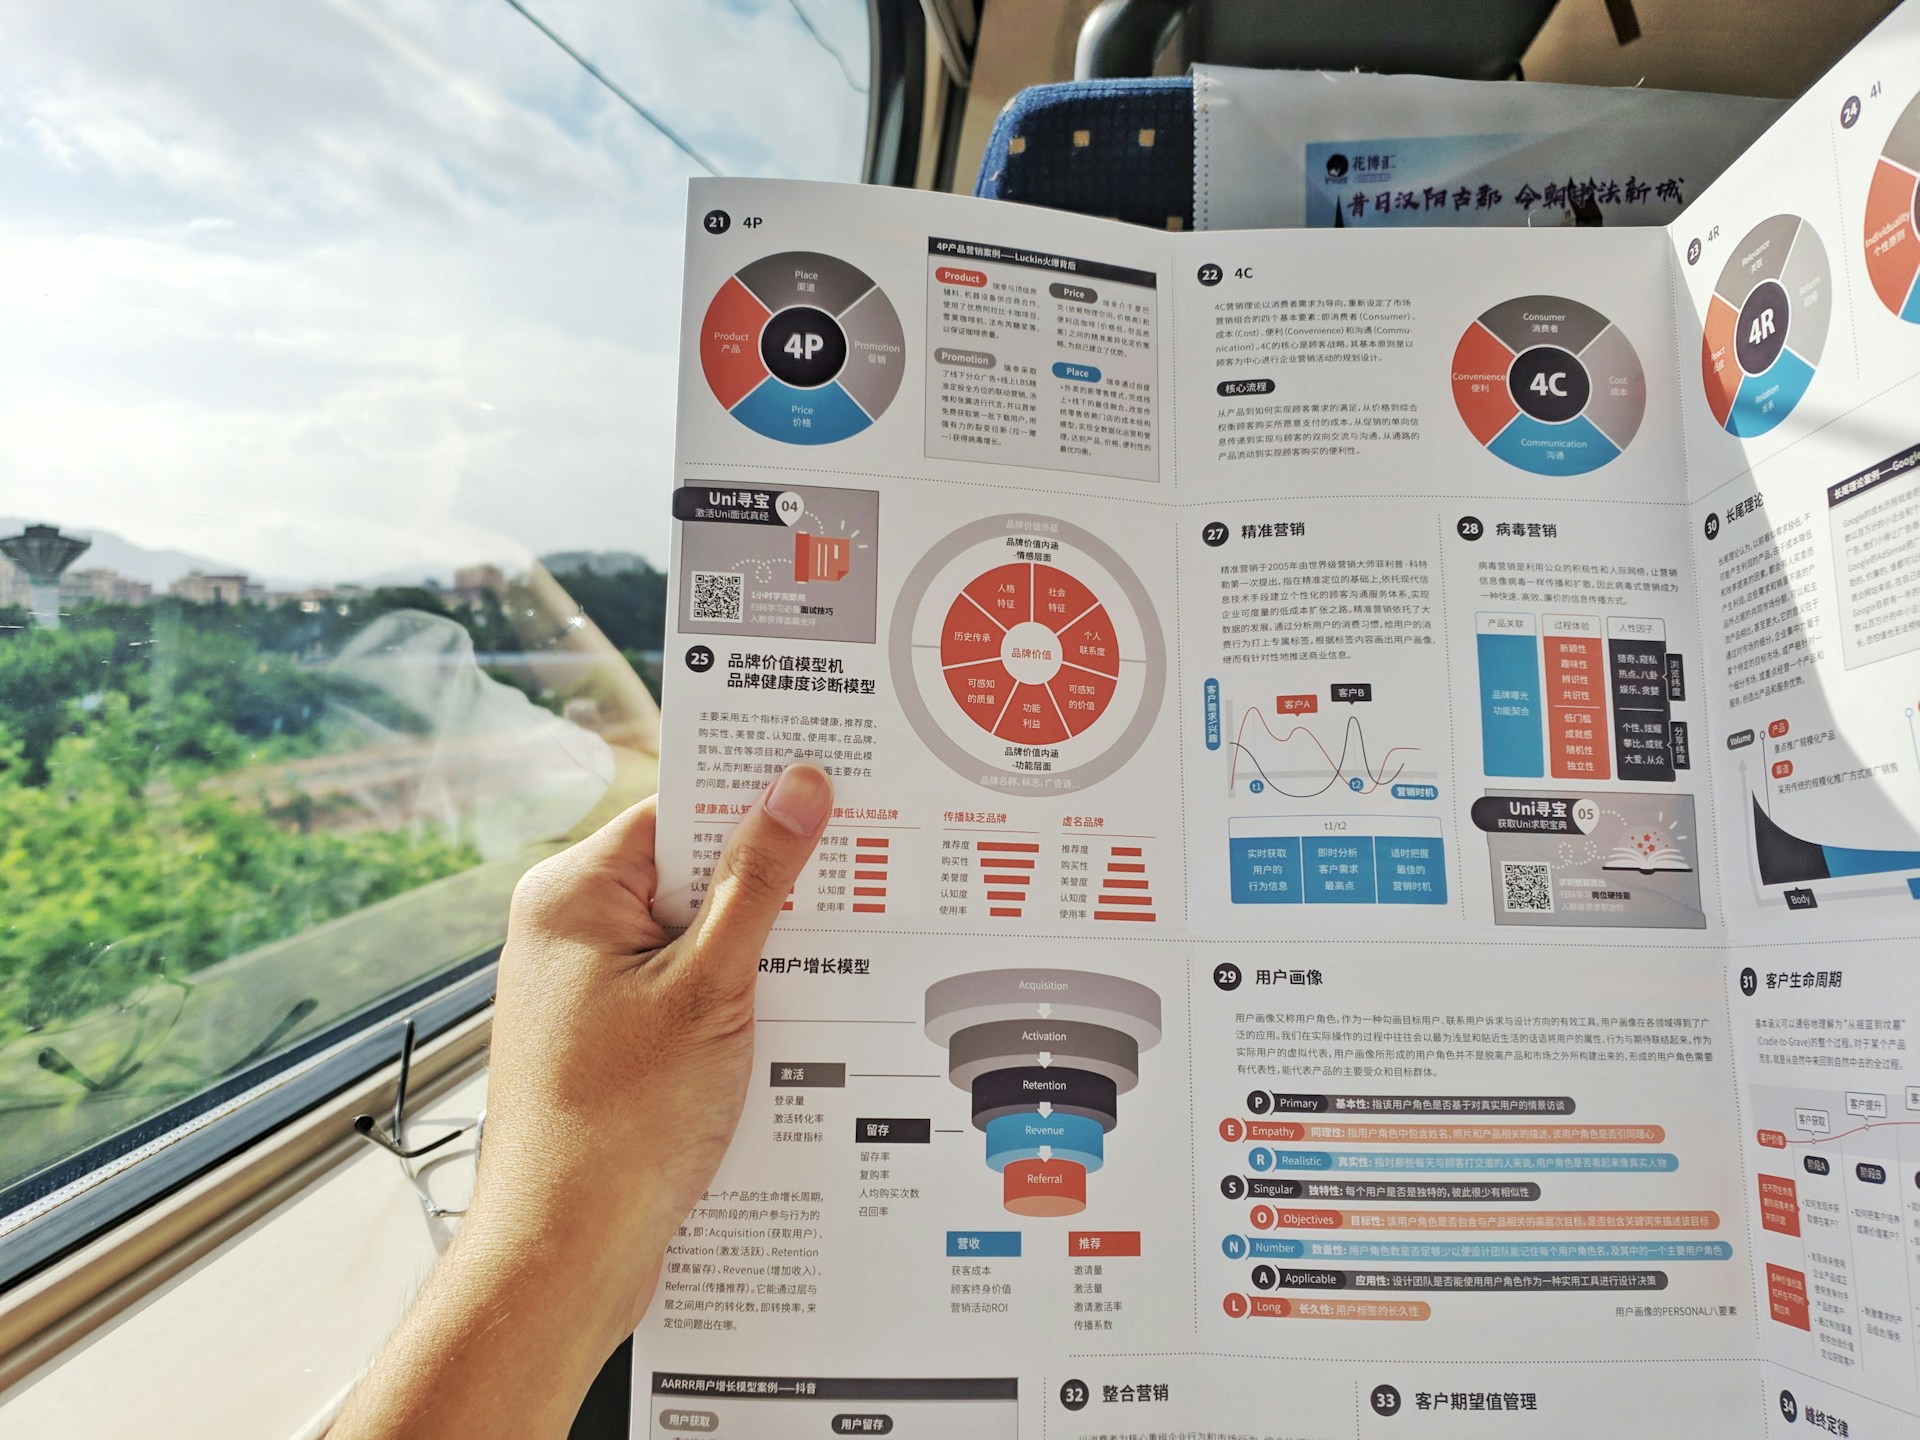
Quick answer: The best AI infographic generator for most people in 2026 is Piktochart, because it turns a prompt, pasted notes or an uploaded document into a fully editable infographic. Venngage is the pick for business and data-heavy graphics, Canva is best for fast social and marketing visuals, Infogram wins for interactive charts, and Napkin AI is the quickest way to turn a paragraph into a clean explanatory visual. Every tool below has a free way to start, so the smartest move is to run one real piece of your own content through two or three of them before paying.
What Is an AI Infographic Generator?
An AI infographic generator is a design tool that turns text, data or a document into a finished infographic by choosing the layout, charts, icons, colors and typography for you. Instead of dragging shapes onto a blank canvas, you describe the topic or paste your source material, and the tool drafts a first version you can edit.
The category has split into three kinds of product, and knowing which one you need saves time:
- Template-first design tools (Canva, VistaCreate) use AI to fill and restyle a huge template library.
- Infographic specialists (Piktochart, Venngage, Easelly, Infogram) are built around structured layouts, charts and data.
- Text-to-visual tools (Napkin AI) read a block of writing and produce diagrams, flows and simple infographics in seconds.
A fourth option has become common: general AI image models that draw an infographic from a prompt. They can look impressive, but text accuracy and exact numbers remain their weak spot, so treat them as a sketch tool rather than a publishing tool.
The 8 Best AI Infographic Generators in 2026 at a Glance
| Tool | Best for | AI input | Data charts | Free way to start |
|---|---|---|---|---|
| Piktochart | Editable business infographics and reports | Prompt, text, notes, documents | Yes | Free plan |
| Venngage | Data and business infographics | Prompt, uploaded documents, CSV | Yes, editable | Free plan |
| Canva | Social, marketing and everyday design | Prompt and template fill | Basic | Free plan |
| Infogram | Interactive data visualization | Topic or pasted data | Strong | Free plan |
| Napkin AI | Turning text into explanatory visuals | Pasted text, documents | Light | Free plan with weekly credits |
| Visme | Presentations, reports and branded content | Prompt and document import | Yes | Free plan |
| Easelly | Dedicated, simple infographics | Templates first, AI secondary | Yes | Free plan |
| VistaCreate | Event and campaign graphics | AI image generation and templates | Basic | Free plan with Pro trial |
Plan limits and prices change often. Check each vendor’s pricing page before you commit.
How We Chose These Tools
We compared the tools against the questions readers actually ask before choosing, using each vendor’s published product documentation, plan pages and feature lists, plus the independent comparisons available in late 2026:
- Quality of the first draft. Does the output look usable, or does it need a rebuild?
- Editability. Can you change every word, number and color after generation?
- Data handling. Can it take a spreadsheet or PDF and keep the numbers correct?
- Text accuracy. Does it spell things properly and keep headlines readable?
- Export and commercial use. Can you download high-resolution files without a forced watermark?
- Free plan honesty. Is the free tier genuinely useful or just a teaser?
A note on transparency: AI infographic tools update constantly, and results depend heavily on your prompt and source material. We recommend testing each tool with your own content, and we flag where a limit is a plan detail you should verify.
1. Piktochart: Best Overall for Editable AI Infographics
Piktochart is a dedicated infographic and visual communication platform. Its AI tools can create editable infographics from prompts, text, notes, data summaries and uploaded documents, which makes it the most flexible starting point when your source material is a messy report or a stack of notes.
What it does well
- Generates structured first drafts rather than a flat image, so every block stays editable.
- Accepts several kinds of source material, including documents, which matters for report-heavy work.
- Covers multiple formats beyond infographics, including presentations and reports.
- Keeps the AI as the start of the process, not the end, so you refine rather than rebuild.
Where it falls short
- Heavier than a simple template tool if you only need one quick social graphic.
- Advanced branding and export options sit on paid plans.
Best for: Marketers, educators, nonprofits and small teams who want a polished infographic from existing content.
2. Venngage: Best for Business and Data Infographics
Venngage is a business-oriented infographic tool whose AI generator accepts prompts, uploaded documents or CSV files. It fills your content into an existing template and, for data infographics, can turn uploaded data into editable charts, which gives you more control over the final design than a flat generated image.
What it does well
- Auto-fills your content into professional templates.
- Generates editable charts from uploaded data.
- Suits reports, process explainers, comparisons and timelines.
Where it falls short
- The best export and brand features are paid.
- Template-driven output can look similar to other Venngage graphics unless you customize.
Best for: Business teams, consultants and analysts who need infographics that stay accurate to the numbers.
3. Canva: Best for Fast Social and Marketing Infographics
Canva remains the easiest design platform to learn, and its AI features sit on top of the biggest template and asset library in this list. For a LinkedIn carousel, an Instagram explainer or a classroom handout, it is usually the fastest path from idea to finished graphic.
What it does well
- Huge template library and easy drag-and-drop editing.
- AI-assisted layouts, text and image generation in one workspace.
- Strong collaboration and one-click resizing for different social formats.
Where it falls short
- Chart and data tools are simpler than Infogram or Venngage.
- Generated layouts can feel generic without your own brand touches.
If you also design flyers and posters, see our guides to the best AI flyer generators and the best AI poster generator tools.
Best for: Social media managers, small businesses, students and teachers.
4. Infogram: Best for Interactive Data Visualization
Infogram is built around charts and data. Its AI generator lets you describe a topic or paste in your data, then produces a structured infographic with suitable layouts, chart types and visual hierarchy. It is the strongest option when your audience will view the result on a website and you want charts that respond to hovering and clicking.
What it does well
- Excellent range of chart and map types.
- Interactive, embeddable outputs for articles and dashboards.
- Good for teams who start from a spreadsheet.
Where it falls short
- Less suited to decorative, illustration-led infographics.
- Interactive embeds may not suit print or PDF-only workflows.
Best for: Journalists, analysts and publishers working with real datasets.
5. Napkin AI: Best for Turning Text Into Explanatory Visuals
Napkin AI converts plain text into editable diagrams, flowcharts and simple infographics, usually in well under a minute. You paste a paragraph, pick the sentence or section you want visualized, and choose from several generated styles. It is less a full infographic designer and more a fast way to explain an idea visually inside a document, post or slide deck.
What it does well
- Extremely fast from text to a clean visual.
- Good at processes, relationships and step-by-step explanations.
- Free plan includes weekly AI credits, unlimited editing, and PNG and PDF export.
Where it falls short
- Free exports carry Napkin branding, so the free plan works as a trial rather than a publishing tool.
- PPT and SVG exports, and branding removal, require a paid plan.
- Credits are consumed as you generate, so heavy use can run through the free allowance quickly.
Best for: Bloggers, consultants and presenters who need quick explainer graphics from existing writing.
6. Visme: Best for Branded Reports and Presentations
Visme blends infographics, presentations, documents and data widgets in one editor. If your infographic is one piece of a larger branded report or deck, keeping everything in one tool can save real time. If you are also comparing slide tools, our guide to the best AI tools for product designers covers adjacent design workflows.
What it does well
- Handles infographics, decks and long-form documents in one place.
- Brand kit support helps keep every output consistent.
- Built-in data widgets and charts.
Where it falls short
- A broader feature set means a steeper learning curve than Canva.
- Some of the best features sit behind paid tiers.
Best for: Marketing teams producing branded reports, decks and infographics together.
7. Easelly: Best for Simple, Dedicated Infographics
Easelly is a long-standing infographic specialist. AI is not its main selling point, but its focus on infographic templates and a straightforward editor makes it a calm choice for people who want a clean layout without extra tools competing for attention.
What it does well
- Infographic-first templates and a simple editor.
- Good for students and first-time creators.
Where it falls short
- AI generation is less central than in Piktochart or Venngage.
- Smaller ecosystem than Canva.
Best for: Beginners and educators who want an infographic-only workflow.
8. VistaCreate: Best for Event and Campaign Graphics
VistaCreate pairs a large template library with AI image generation and design editing. AI plays a smaller role in the actual infographic workflow, but it is a practical, budget-friendly option for event announcements, campaign explainers and social posts, and it offers a free plan along with a trial of its Pro tier.
What it does well
- Strong templates for events and social campaigns.
- AI image generation and background tools inside the editor.
Where it falls short
- Less data-focused than Venngage or Infogram.
Best for: Small businesses and event organizers.
Which AI Infographic Generator Should You Choose?
| If you need… | Choose |
|---|---|
| An editable infographic from a report, notes or a PDF | Piktochart |
| Accurate, data-driven business infographics | Venngage |
| A fast social or classroom graphic | Canva |
| Interactive charts for a website or article | Infogram |
| A quick visual from a paragraph of text | Napkin AI |
| Infographic, deck and report in one branded workspace | Visme |
| A simple, infographic-only tool | Easelly |
| Event and campaign visuals on a budget | VistaCreate |
How to Make an Infographic With AI in 5 Steps
- Start with a single message. Write one sentence that states what the reader should understand or do. Everything else supports that sentence.
- Gather real data. Collect two to six verified statistics or steps. AI can design numbers, but it cannot check them, so use sources you trust.
- Prompt or upload. Paste your text or upload your document, CSV or PDF, and state the audience, tone and format.
- Edit the draft. Fix every number, label and heading. Replace generic icons with ones that match your topic, and align colors with your brand.
- Check, export and credit. Proofread for spelling and accuracy, confirm any source credit, and export in the format you need: PNG for social, PDF for print, SVG where available.
12 Copy-and-Paste Prompts for AI Infographics
These prompts work in most tools. Swap the bracketed parts for your own details.
- “Create a vertical infographic that explains [topic] in 5 steps for beginners. Use a clean modern style, short headings and simple icons.”
- “Turn this data into a one-page infographic with a headline, three key statistics and one bar chart: [paste data].”
- “Design a timeline infographic of [event or project] from [year] to [year], with one line per milestone.”
- “Make a comparison infographic of [option A] versus [option B] with pros, cons and a one-line verdict.”
- “Summarize this article as an infographic with a title, five takeaways and a call to action: [paste text].”
- “Create a process flow infographic showing how [process] works, with numbered stages and short descriptions.”
- “Design a LinkedIn carousel of 6 slides that explains [topic], one idea per slide, consistent colors.”
- “Build a checklist infographic for [task], with 10 items grouped into three categories.”
- “Create a classroom infographic about [subject] for [age group], with large readable text and friendly icons.”
- “Turn this survey result into an infographic with a pie chart, a headline percentage and a short takeaway: [paste results].”
- “Make a how-to infographic for [product feature], showing before and after, in our brand colors [hex codes].”
- “Design a statistics roundup infographic on [industry] with four numbers, each with a one-line source label.”
Prompt tip: The more specific your audience, format and structure, the less editing you will do afterward.
Common Mistakes to Avoid
- Publishing numbers you did not check. AI tools can misplace or alter figures. Verify every statistic against its source.
- Overcrowding the design. More text rarely means more clarity. One message and a few strong visuals outperform a dense wall of facts.
- Ignoring accessibility. Use sufficient color contrast, readable font sizes and descriptive alt text so everyone can use your graphic.
- Skipping the source line. Credit your data. It builds trust with readers and with search engines.
- Using a free watermarked export commercially. If a free plan adds branding, treat it as a draft.
Can You Use AI Infographics Commercially?
Usually yes, but terms vary by tool and plan. Commercial use, licensing for stock assets, and watermark removal can differ between free and paid tiers. Read the current terms of service for the tool you use, and keep records of the sources behind your data. This is general information, not legal advice.
Frequently Asked Questions
What is the best free AI infographic generator?
Canva, Piktochart, Venngage, Infogram, Visme, Easelly and VistaCreate all offer free plans, and Napkin AI offers weekly free credits. Canva is the easiest for beginners, while Piktochart and Venngage give the most infographic-specific AI features. Free plans usually limit exports, templates or branding, so confirm the limits first.
Can AI create an infographic from a PDF or document?
Yes. Piktochart and Venngage both accept uploaded documents, and Napkin AI can work from imported text. For long reports, upload the document, then edit the draft carefully, because summarizing can drop context.
Can AI create an infographic from a spreadsheet or CSV?
Yes. Venngage accepts CSV files and can build editable charts from them, and Infogram is designed around data. Always check that the chart values match your source file.
Is there an AI that makes infographics from text?
Yes. Napkin AI is built for exactly this, and Piktochart, Venngage and Canva also generate layouts from typed prompts.
Can ChatGPT or other AI chatbots make infographics?
General chatbots and image models can generate infographic-style images, but small text errors and wrong numbers are common. A dedicated tool with editable text and real charts is safer for anything you will publish.
Are AI infographic generators accurate?
They are accurate to the data you give them, not to the facts of the world. The design is automated; the fact-checking is your job.
Which AI infographic maker is best for teachers and students?
Canva and Easelly are the easiest to learn, and both have free options. Choose Canva for variety and collaboration, or Easelly for a focused, infographic-only experience.
How long does it take to make an infographic with AI?
A first draft usually takes under a minute. A publishable version, with fact-checking and editing, typically takes 15 to 45 minutes.
What size should an infographic be?
For blogs, a vertical image around 800 pixels wide works well. For social, follow each platform’s current recommended ratio, and export at higher resolution for print.
Will AI replace graphic designers for infographics?
AI speeds up first drafts, but brand judgment, storytelling and accuracy still need people. Designers increasingly spend less time on production and more on refinement.
Related Guides From LA Tech Post
- Top 5 free AI icon generators for the icons that make infographics readable
- AI illustration generators for custom artwork
- Remove a background from an image instantly to clean up photos before you place them
- Create a logo with AI in minutes to keep your branding consistent
- Best AI website builders in 2026 for publishing your finished visuals
Final Verdict
The right AI infographic generator is the one that matches how you work. Choose Piktochart when you want a flexible, editable draft from any source, Venngage when numbers matter most, Canva when speed and social reach matter, Infogram for interactive data, and Napkin AI when you simply need to explain an idea fast. Whichever you pick, the winning workflow is the same: bring one clear message and verified data, let the AI draft the design, then edit with a human eye.






Be First to Comment